Empower Customers with Data Ownership and Metrics Management and Reduce Tech Support Requests.
Defining Expectations
Project
Function AI ARMs (Artificial Intelligence Management System)
Roles
Lead UX Designer, Researcher, Project Manager and Owner
Timeline
3 Months (2017) for design of ARMs.
Tools
Sketch, Adobe Creative Suite, Google Sides, Balsamique
Best In Class Reporting Tools
How can we give customers access to their most common data reports?

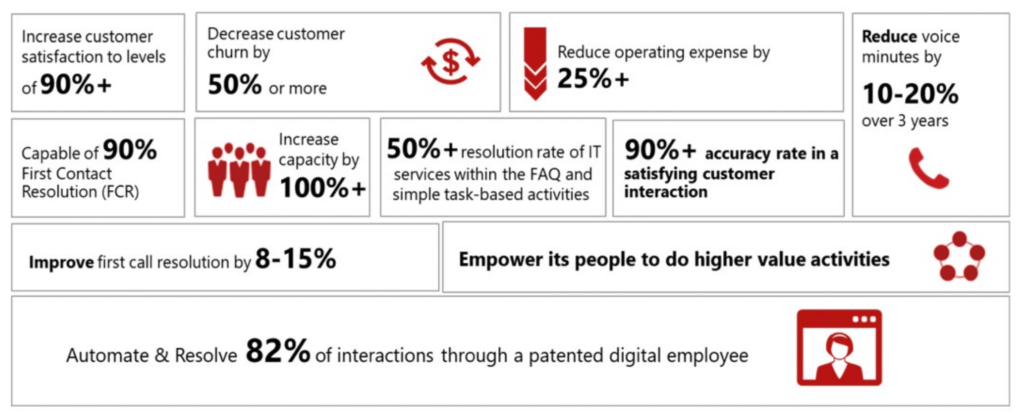
Success Metrics
How do we make the customer data visually useful and actionable?

Doing the Research
Finding the Opportunities
Customer Needs
Researched the various reports requested by customers as well as the purpose for the reports.
Data Structures
Analyzed the available data objects available from the AI implementations to create and define useful and informative relationships for reporting.
ROI Mapping
Because of the narrow audience for this emerging tech, I concentrated on mapping the marketable benefits as would be discoverable using the ARMs tool.
Data Structures
When defining these massive amounts of date, I first established taxonomy. Within ARMS data could be Persona data, Customer data, Inquiry data, or a subset variety of system admin data. The hypothetical and most common user would deal less with the admin so I focused on the main three.
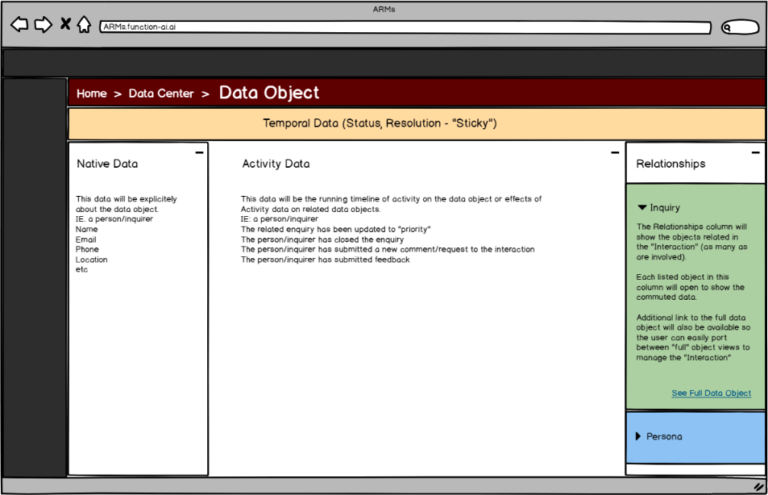
First I defined NATIVE DATA, the data that must exist for the object to exist.
| Customer | object |
| Name | Bob |
| ID | 000234456 |
| bob@bobsburgers.com |
| Persona | object |
| Channel | Voice |
| Implementation | Phon IVR |
| Languages | EN |
| Inquiry | object |
| Date | MM/DD/YYYY |
| Type | Error/bug |
| Details | A long time ago... |
Next I defined the ACTIVITY DATA. This data modifies a data object and can be modified and can be reported as activity.
| Customer | object |
| Status* | registered |
| User Role | manager |
| Contact Info | [subset] |
*Temporal Data
| Persona | object |
| Gender | Female |
| Skills | [subset] |
| Status* | Available |
*Temporal Data
| Inquiry | object |
| Actions | [subset] |
| Resolutions | [subset] |
| Status* | Open |
*Temporal Data
Last I defined RELATIONAL DATA. This is commuted data.
| Customer | object |
| Inquiries | [subset] |
| Personas | [subset] |
| Persona | object |
| Customers | [subset] |
| Inquiries | [subset] |
| Inquiry | object |
| Customers | [subset] |
| Personas | [subset] |
From these classifications I started to build the model for the data object, and how a user would need to see and understand the object structure.

ROI Mapping

Opportunities for Success
Robust Dashboard
Offering the customer the data they need At-A-Glance style would answer about 75% of the current request tickets.
Filtering
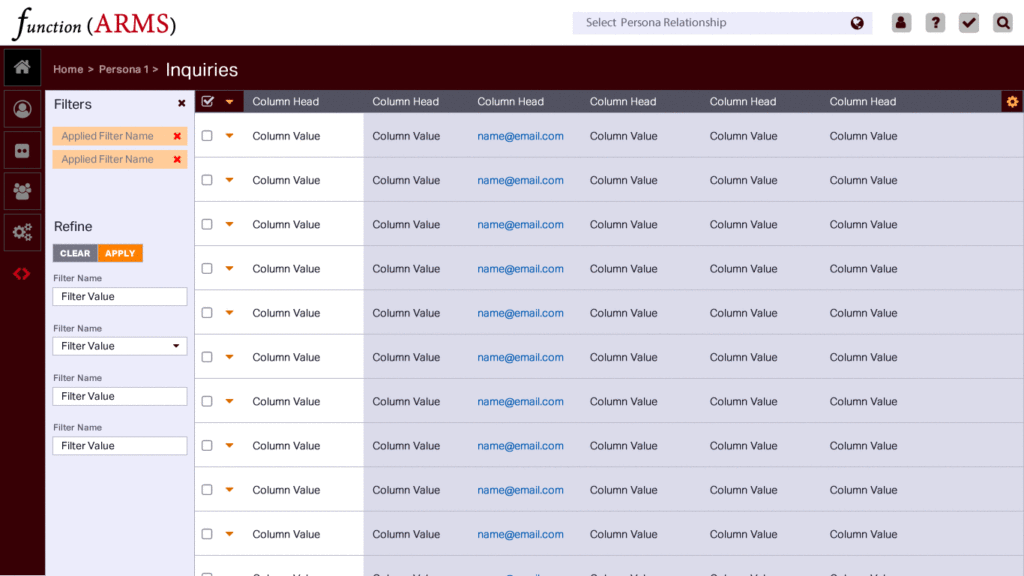
By concentrating on empowering and simplifying the data filters, I could give customers the power to create and save their most useful reports.
Data Maturation
I needed to represent the data object maturation timeline (initiation, escalation, resolution, etc) using recognizable UI patterns.
Design
Designing the Experience
Mid-Fidelity
I wireframed common reporting pages focusing on filtering and customizing the data grids, the dashboard for its usefulness, and the data object view for is management functions.
Prototype
Using the branded design system, I converted the wireframes from low to high fidelity designs.
Usability
I ran comprehension tests with end users. I was unable to use actual data values so I tested user expectations for common areas like filters, grid views, dashboard widgets and other common actionable elements.
Prototype
To prove the product, I created functional prototypes in Invision for stakeholder interaction and usability testing.

Usability Findings
Recognition
All users were able to identify common reporting UIs and patterns. All action expectations were 100% correct.
Data Maturation
Users expressed light confusion of the "activity" model. Rework using a Facebook-style feed brought much more positive responses.
Saved Reports
Users could not easily navigate or intuit the location for saved reports. Rework was necessary for the Dashboard.
Wrap Up
After testing, I met with stakeholders and leadership to report on user feedback focusing on usefulness and potential adoption. The project was approved. After Rework, I prepared the final design files and prototype for dev handoff. My project management consisted of monthly progress meetings as well as all materials requests.
Reflections
"Don't Reinvent the Wheel"
Borrowing almost completely from leading report software, I was able to product the bulk of the prototype very quickly while also answering most of the customer needs.
Never Forget Your User
By not offering Saved Reports in a prominent and obvious way, I neglected one of the original user stories defining those users that repeated requests for the same data on a regular schedule.