Testing the Value and Usefulness of the Unum Maternity Leave Tool, Based on New, Current and Previous Users Across the Maternity Timeline.
Defining Expectations
Project
Unum Maternity Leave Tool
Roles
Lead UX Researcher
Timeline
Ongoing
Tools
Google Forms, SurveyMonkey
Existing Tool
This tool was created to help with employees needing maternity leave (birth and adoption). The tool helped prospective parents plan their journey backwards from the expected birth date. The tool allowed employees to plan the expected absence from work but it also included features such as prenatal care milestones and support services. The tool was released to Unum employees a year earlier and the user group included over 350 members.
The Goals
Test Usability.
Test User Satisfaction.
Measure Value in a Meaningful Way
The Challenge
The majority of users had completed the experience over the span of the previous year; Their experiential data would be "fuzzy" both for usability and for satisfaction the longer the time elapsed. Current active users were less in number and in different stages of their maternity experience. The tool followed users through a planned experience that would start and expire. At each stage of the timeline, the usability of the tool changed, as did the expectation of the user. The life event for which the tool was designed is also commonly the most stressful experience in a human life. It would be important to capture the data with as little emotional bias as possible.
Doing the Research
Finding the Opportunities
Define the Users
Users were most easily grouped into sets along the maternity timeline.
Define the Timeline
I compared a maternity timeline to the tools offerings at various intervals to define "states".
Find Correlations
Because the tool offered different features and functions for the different timeline states, I had to create unique but correlating metrics that would measure the desired success parameters.
The Users as The Timeline
I decided to divide the user group into the following sub-groups:
| Current "new users" | registered, expecting and planning leave |
| Current "absent" users | registered users currently on maternity planned leave |
| Current "returned" users | registered users returning to work from planned maternity leave within the last 3 months |
| "Inactive" users | registered users returned to work more than 3 months. |
By breaking up the users across the timeline, both expired and running, I could set expectations for what data could most effectively be captured. Inactive users could easily report on overall satisfaction and perceived usability. Current users could report on more specific usability values but their responses could have more emotional bias.
A plan was made in favor of email surveys. Four surveys were planned for the four sub-groups.
Opportunities for Success
Establish Baseline
Since a majority of the users were "inactive", I would serve them the final survey of a sequence of 4 in order to establish broad metrics on satisfaction and usability.
Feature Correlations
I could design each survey in the sequence to gather correlating metrics but ask about specific offerings in specific time periods.
Design
Designing the Test
Define Metrics
Based on business objectives for usability and satisfaction, I defined 6 metrics to gather in each survey.
Create Surveys
I wrote 6 questions for each survey designed to gather, validate and correlate the 6 metrics.
The Tests
Each survey in the sequence of 4 asked different but correlating questions to gauge the same defined success values. The questions varied in specifics based upon where in the timeline the user fell and what the tool offered to the different user states.
| Question | Answer Method | Data Type |
| How Easy was/is the tool to use? | numeric rating | ease of use |
| What did you expect from the tool? | free text | user expectation |
| What did the tool do for you? | free text | user understanding |
| Did the tool do what you expected? | Yes/No | perceived success |
| How prepared do/did you feel? | numeric rating | user confidence / product value |
| Would you recommend this product? | numeric rating | Net Promoter Score |
Ease of Use - New users were asked "How easy was it to create your account?" while Absent users were asked "How easy was it to confirm your return to work date with your manager?" to gauge the same usability data at different points on the experience timeline. This would tell us the perceived ease of use as well as hint at where improvements could be made.
User Expectation - Before measuring any success or confidence, I wanted to first measure how correctly the user imagined the tool. While the tool might perform as designed, it might fail the user's expectation. This free-text answer would also allow us to see what users would want the tool to do, giving us valuable future features and improvements.
User Understanding - I also wanted to measure the user's understanding of the product after practical use. Did the user understand what just happened? Did the user understand the impact of their interaction? The tool might perform as expected but might not communicate that achievement to the user.
Perceived Success - Was the tool successful to the user? This simple boolean value is still based on user perception but it can be corroborated with the previous questions' answers. It can also show how to correct if necessary. How to better perform for users OR how to better set user expectations.
User Confidence/Product Value - We ask the user for a loaded emotional rating. We ask this question at the end so that the first questions engage the user's critical thinking. The rating will indicate the user's perceived satisfaction and confidence. The higher the confidence, the more valuable the product.
We end the test with a standard NPS.
Next I refined the values to "Personalized Care", "Customer Confidence", and "Usability and Ease". These small changes in the language gave huge context to the goal.
Selecting one value at a time, I began looking for ways to increase each.
Wrap Up
The test(s) proved successful in that the data collected showed us that the tool was very valued by the users overall. We were also given valuable insight into pain points, miscommunication and unanswered expectations. The project was promoted internally as successful and green lighted for public release and future development. The tests were adopted as procedure and are ongoing.
Results
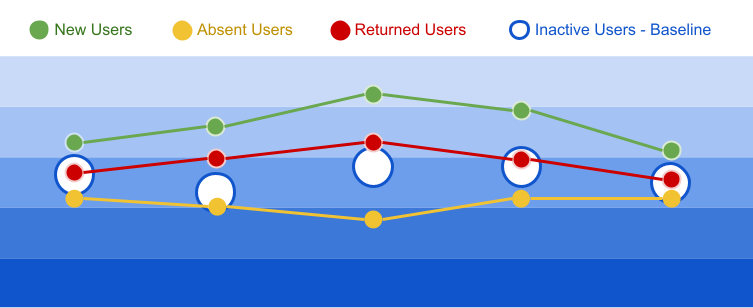
We had an amazing response to the surveys, collecting over 270 respondents with the first emails. The collected data was given a scoring system and the data was plotted. The following example shows how a user can be surveyed over the course of their experience. Across multiple users we were able plot patterns both in actual success and emotional responses.
For instance, most new users were more emotional in both positive and negative responses. Absent users gave the least positive data. From this we might conjecture that the tool under performed, or that the users were less enthusiastic about work-related activities during their new parent experience.
